 Hi, I'm Peter Rose, Founder of Longwood Currency Trading, and welcome to LCT Blog Post 07/07/20 — How To Use Moving Averages Correctly In Your FOREX Trading.
Moving average analysis is often misinterpreted as being able to predict some price action that will continue in the future.
Moving averages are only a picture of what has happened in the past, just as a chart of coin flips. But neither can be used to predict what will, or even what could happen next, or in the future.
Using moving averages for a prediction of future price action is simply not supported: Not from a logical standpoint, not if looked at empirically, not based on any psychological principles, and certainly not from a mathematical basis, or anything in accordance with the laws of physics.
Having said that, the proper use of moving averages can assist a trader in decision making process, whether that be setup analysis, position management, or exit strategy.
In this post, I cover 4 aspects of moving averages as to how they can be used as analytical tools against current price action. In a nutshell, moving averages reveal the following past information about price:
Taken individually, there is no predictive capability. Though some possible useful information could be derived from a confluence of occurrence among these moving average events, far more benefit and utility can be had if there is not only that confluence, but also confluence with other indicators that represent similar event markers.
I have a companion video of the same title on my YouTube channel for Longwood Currency Trading. I've provided a link to this video at the end of this post for your reference if interested.
The point of this post is not to demonstrate confluence with other indicators, but rather to identify what aspects of a moving average are base indicators of what is going on with the underlying past — past — price action.
Moving averages are too often referred to as 'indicators'. But they don't 'indicate' anything.
A shovel is not an indicator that a hole might, could, or should be dug. But it is a tool that might, could, or (if asked!) should be used to dig a hole. By itself, a tool does nothing. Rather it's how you use the tool that determines it's usefulness.
If I tried to steer a car with a shovel, that wouldn't make any sense. However, by using it to dig a hole would.
Oh, sure... I might be able to steer a car with a shovel, but at what risk?
Obviously, tools have to be used within the proper context, or that doesn't make sense either, right?
If that's the reasonable case, then why do so many educational resources use moving averages as indicators instead of as tools?
Let's take a look at how a moving average then might be used as a tool within the proper context of that use under the 4 scenarios I identified at the beginning of this post, i.e.:
1) Past price action.
Regardless of the time frame you're looking at, price action itself — the varying sizes of the candles, and the movement among the candles themselves — produces jagged trails across the chart.
You can see this below on a 1 hour chart of EUR/USD taken 06/30/20:
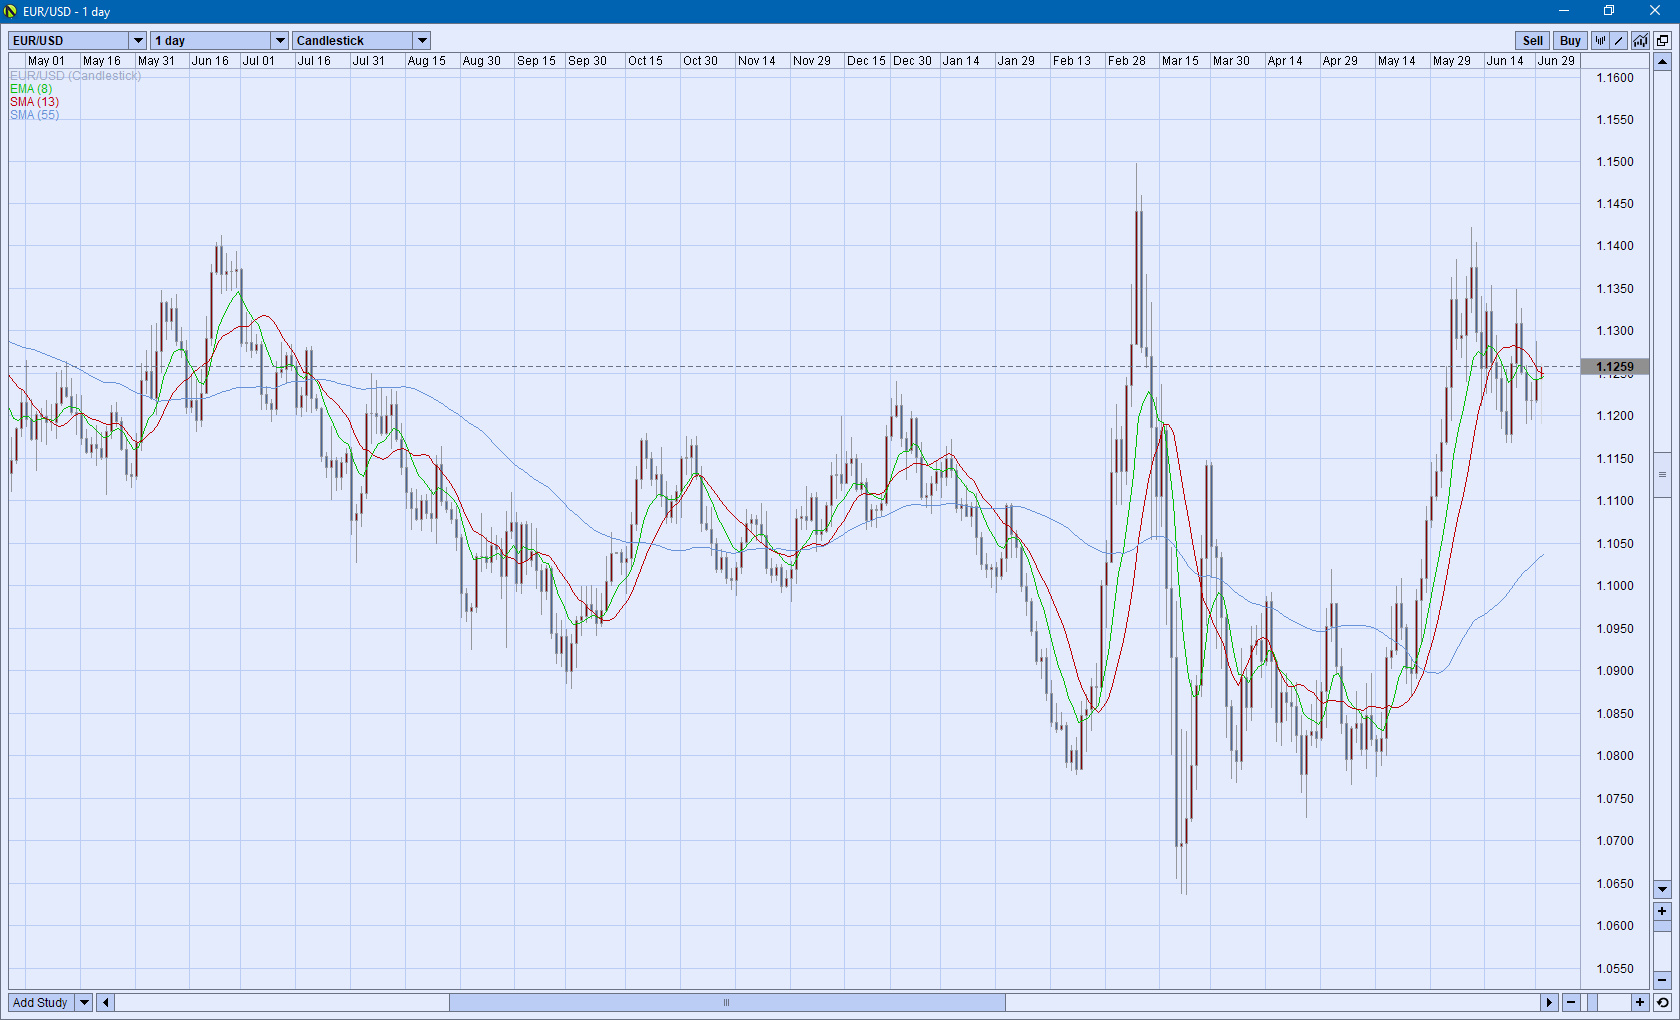
Figure 1: EUR/USD 1 hour 06/30/20
However, you can also see how the light blue 55 period sma (simple moving average) line smoothes that jaggedness out.
A 100 period sma would smoothe it out more, as would a 200 sma. But the more smoothing you do by increasing the period of the moving average, the more it flattens into a straight line.
Once that happens, all useful information about the underlying price action itself becomes meaningless. In mathematics, this is referred to as the Law of Diminishing Returns:
A version of this can be stated mathematically with f(x) = f(0)e-rx where r is the rate of compounded diminishing return, and is really just exponential decay. How dull....
So then, if the larger, i.e. longer, you make the moving average the underlying information becomes meaningless, why use them?
Great question! First, understand that the reason you want to use longer moving averages is to show what the long term slope of overall price action is. Traders are interested in the slope of that moving average line because it represents the 'trend' of price action within a certain time frame.
You have to balance this 'trend' with the time frame you're looking at that price action on. This means that a 'long' moving average on one time frame just flattens the slope of the trend to 0, whereas on another time frame that same moving average may provide very useful information.
Understanding the relevance of past price action to potential current and future price action is influenced by where current price action lies within some trend identified by that longer period moving average.
Let's take a look at Figure 1 again—
Figure 1: EUR/USD 1 hour 06/30/20
That blue, longer, 55 period sma shows that over many, many hours of time (55 hours; a couple of days) price has been trending down, whereas the shorter green 8 period ema, and 21 period sma moving averages indicate something totally different.
As a trader, what are your thoughts about this?
Well, just looking objectively at this chart and current price action, it would appear that current price action might, could, or possibly even should start to roll over and fall in order to average price action over the long term to that of falling.
You can see that both 8 and 21 period moving averages have, in fact, begun to arch over and might, could, or possibly even should thus indicate that this is exactly what the underlying price has already started to do.
A big issue here, however, is that the 55 period sma has begun to rise against that downward long term price trend. That's very interesting as it may indicate that lowest of low price action back to the left around mid-June may, in long term hindsight, was a major swing point for price action to reverse the down trend to that of up trending.
At this point, you'd want to go out to the 4 hour, or possibly the daily chart time frame and check out that price action against the similar set of moving averages.
This chart representing just the last 480 hours of price action — 30 days (20 trading days) the way that I have the screen formatted — is only representative of large institutional transactions over a small, but significant, time frame in relation to what you might see happening out on the daily chart over the last year.
Take a look at the 4 hour and daily charts, and see what you think—
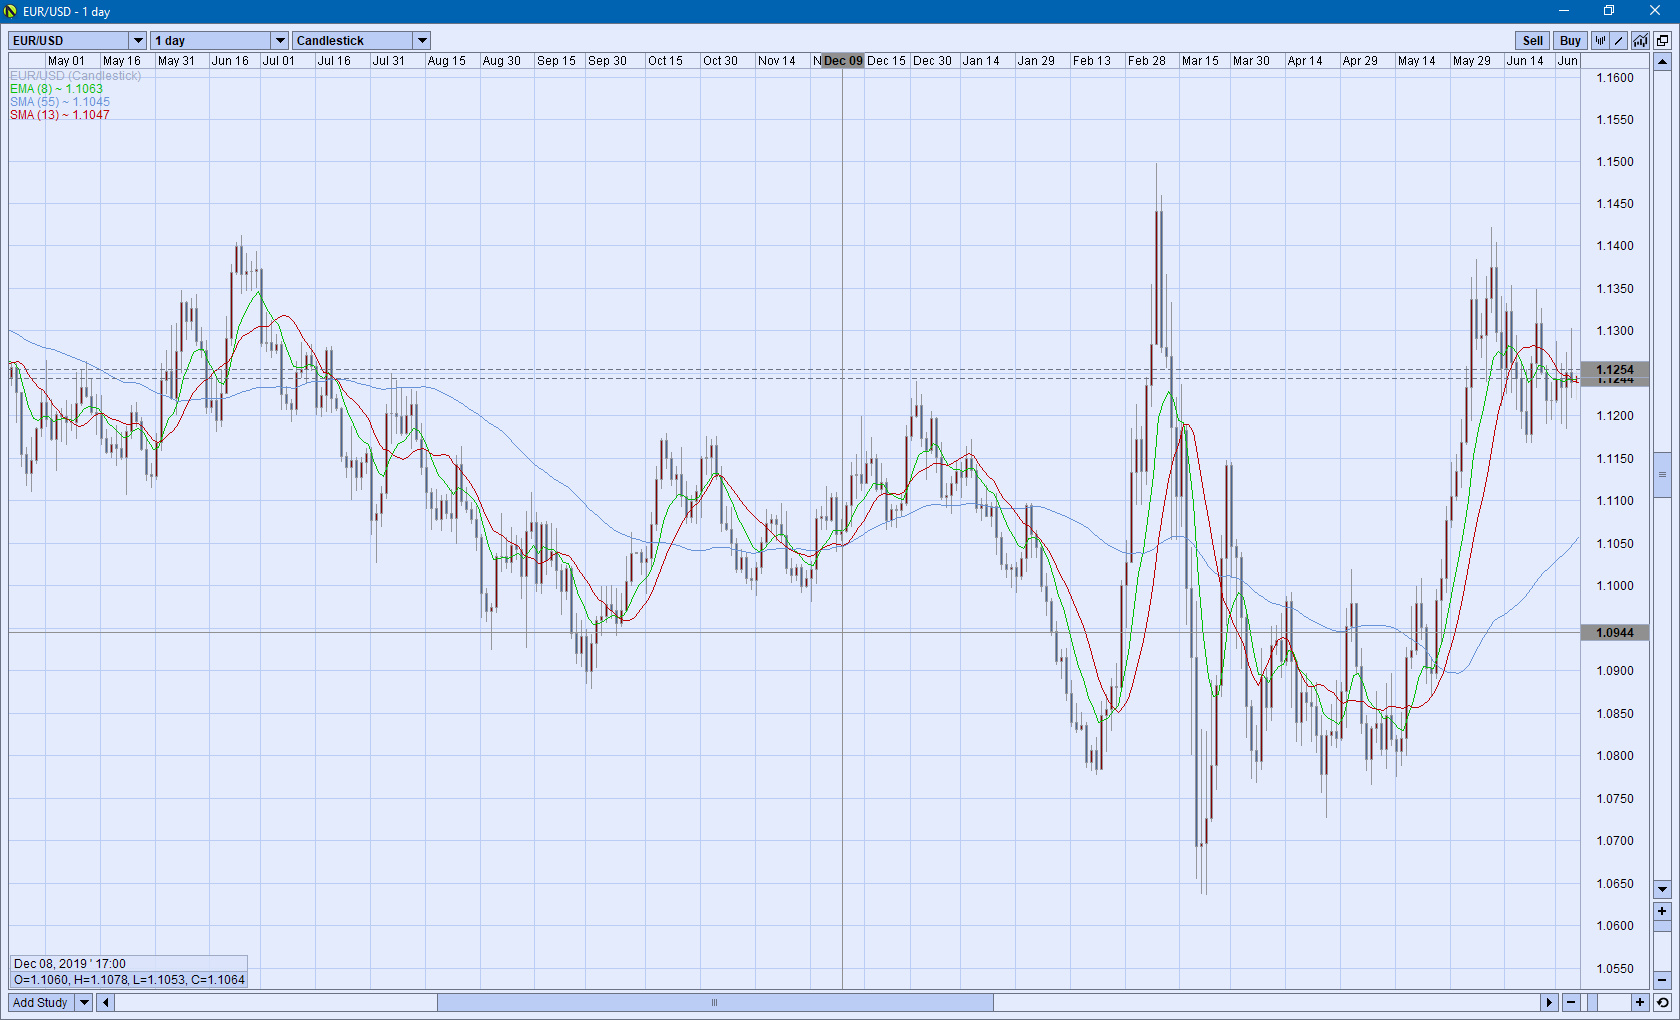
Figure 2: EUR/USD 4 hour 06/30/20
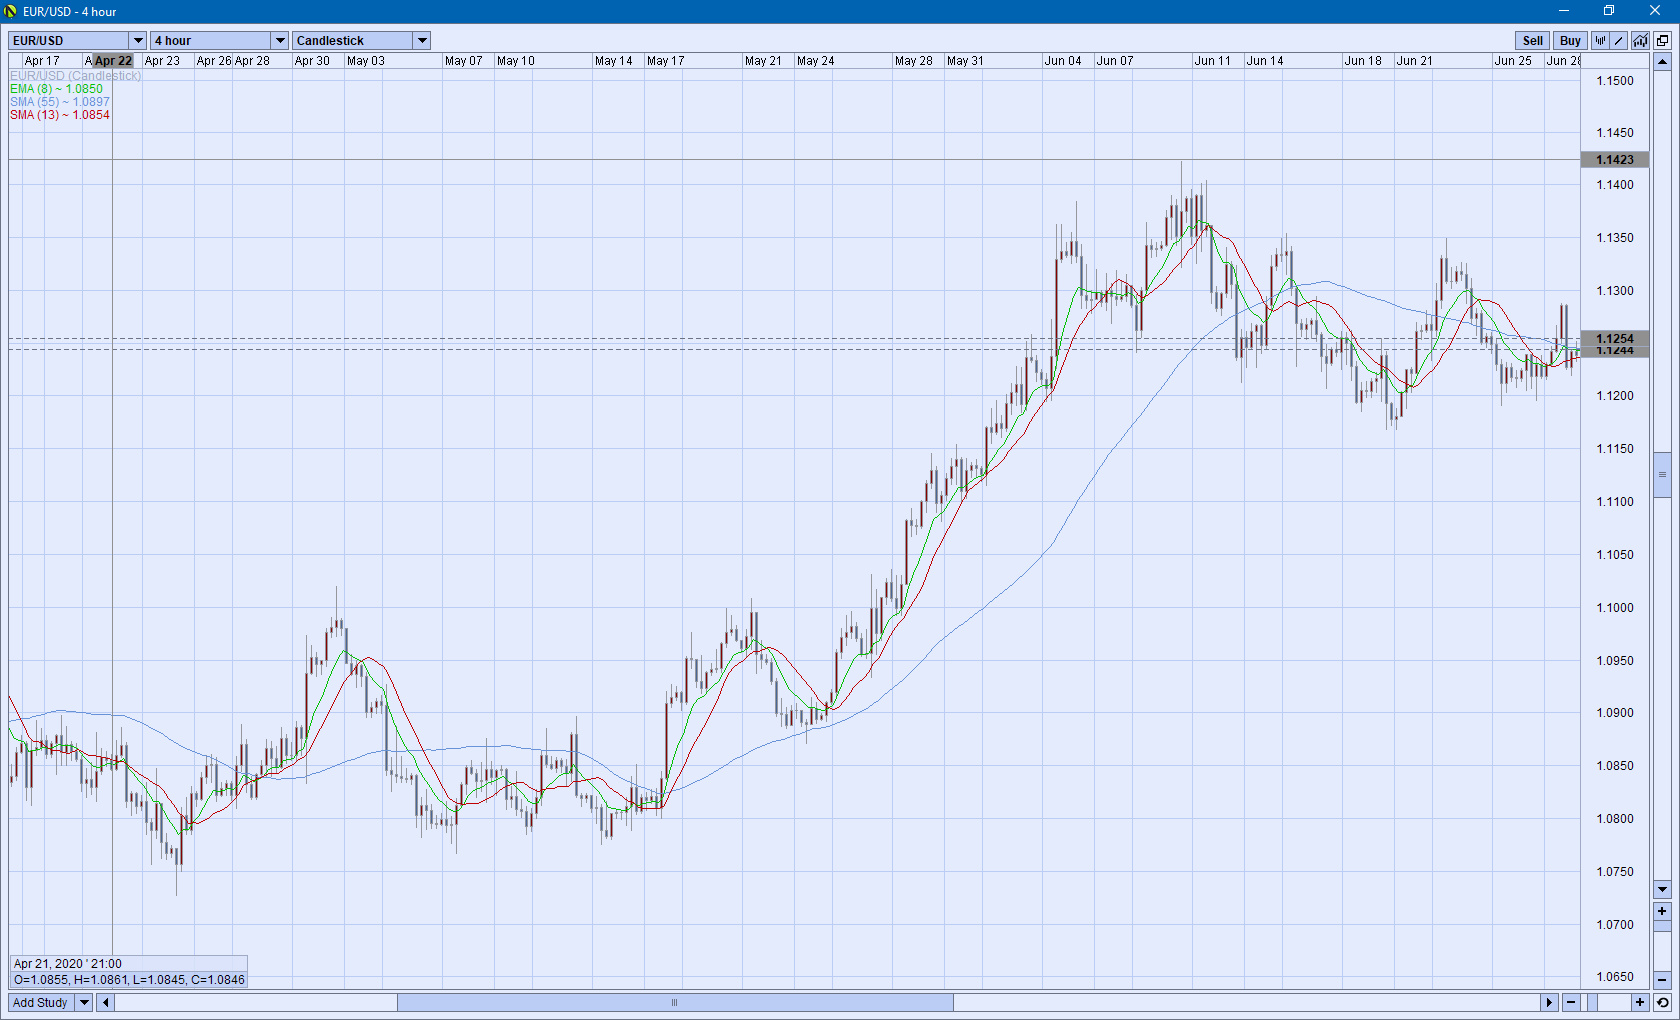
Figure 3: EUR/USD Daily 06/30/20
The 4 hour time frame seems to support the 1 hour time frame that perhaps a swing point was reached, and that the trend of future price action might, could, and maybe even should change to trending upward....
However... the daily time frame contradicts this by showing long term price action to be in a downward trend.
So, now what do you do?
Sorry, this isn't a how to trade discussion, but only one of correct application of moving averages as tools, not as 'indicators'.
And this is a perfect example of how a good mentor comes into play. How is a blog post, video, or book going to effectively discuss all of the very complex interactions among chart time frame, moving average selection, and moving average type (i.e. sma vs ema), just to mention a few of the potential so-called 'indicator' variables that you could mix in here?
Sorry, but without a mentor: it's probably not going to happen....
Al Brooks attempts this in the books that he writes. As a scientist and doctor, he has the chops to know what all of these variables are, and how they interact. But you have to have a lot of patience in order to not only work your way through all of the possibilities that he discusses, but you have to hold all of that in your head long enough to make the logical correlations that he draws from his analysis.
For example, take a look at his 2012 Trading Price Action Trends. That's a tough read, and even he says that you can't just read it and 'get it', but rather you'll have to actually study it, and read it many, many times in order to get anything out of it.
But if your brain is just not analytical enough to manage understanding the nuances in price action that he's trying to describe, then you're going to need a mentor to walk you though it visually, without all of the clutter.
But not just any mentor; not just a 'teacher'. A real mentor is someone who can help you visualize what's going on under the sheets without overloading you with so much information that it flares your roids.
2) Cross over triggers.Using moving averages as cross over triggers is one of the most common applications traders use as indicators of potential current and future price action.
Look again at the below Figure 1, 1 hour EUR/USD chart for instances of where the fast green 8 period ema line crosses the slower red 21 period sma....
Figure 1: EUR/USD 1 hour 06/30/20
An example of how a cross over trading system works might be as follows: When the fast 8 period ema crosses upward through the slower 21 period sma, the system calls for a buy order to be executed, whereas when the 8 period ema crosses downward through the slower 21 period sma, a sell order should be executed.
Seems simple enough. And it is.
However, eyeballing it on a chart of past price action, as opposed to making those decisions in real time results in totally different P&L outcomes. Trust me on that.
Most — most — of the time it works out in real time as long as price has solid trending characteristics through the swing points. However, when price starts to chop, which it does quite a bit of the time, following such a strategy will run your account to the wood.
Does that mean moving average cross over triggers are useless?
Well, if you use a moving average cross over as an indicator of some form of triggering event, then yes, they are useless — based on reasons similar to that in the example I just gave.
However, because moving averages are tools as opposed to 'indicators', let's look at a different approach to viewing the usefulness of them as cross over triggers.
Well, first off: you have to eliminate the description of a cross over as a 'trigger'. The term trigger connotates use as an indicator, so that's out.
Instead of 'trigger', the event of a moving average cross over should be identified as a point.
Okay, but what does that mean?
The First item is 'what' happened. This is more in line with the definition of an indicator if solely interpreted that way. But regardless of that: something has changed, and the cross over point indicates this.
It's the Second item that represents a tool that alerts us to some underlying change in 'why' overall price direction could be changing based on how traders are executing their orders.
What this means is that you can't talk about imbalance of order flow in the same manner as you would a stock, or wheat, or oil, for example. There is no 'imbalance' in orders: there are only buyers matching their orders against sellers.
Price moves up, for example, because more traders are bidding for a transaction at some price than there may be sellers that want to sell, until they do sell at that higher level — for whatever underlying reason they have.
What's really being transacted here is just price....
This dramatically changes the way that we have to look at order flow in the currency market.
We can't just say that price went up because folks wanted more corn. A currency pair price went up because there were traders willing to pay more for the currency of one country over that of another.
So, if that's the case, then how should a cross over event be interpreted correctly as to use as a signal to place a trade if there's no supply/demand model to base it on?
Great question!
Simple answer....
The implication of the use of the tool in this manner is that a trade cannot be taken until enough movement confirms that a swing point has been achieved.
By doing this, however, it means that you need other tools to judge whether price has the momentum to continue in that direction, and to continue in that direction a sufficient distance to provide a good profit potential on the trade before the next swing point is reached.
3) Support and resistance.I'm going to make this section brief because the issues that I raised in the previous section on Cross over triggers are easily mappable here for support and resistance type boundary areas.
Support and resistance areas — or zones for trend lines — are used in a very similar fashion by traders as indicators to predict a change in price direction. Price reaching such an area is interpreted as a potential 'trigger' to execute a trade.
However, just as in the case of moving average cross over 'triggers' they should not be interpreted in this way. Like moving averages, these areas are all formed by past price action, and have little to do with what might, could, or should happen currently or in the future.
4) Hooke's Law and reversion to the mean analysis.
Again, I'm not going to spend a lot of time discussing this material for 2 reasons.
First, there's a lot of theoretical mathematics involved here that really is not relevant to using the results of that analysis.
Second, because the moving average that is used is exactly the mean that price is reverting to, the entire previous discussions of: Past price action, Cross over triggers, and Support and resistance are directly mappable here.
Basically, Hooke's Law is the mathematical representation of reversion to the mean for a spring.
For a spring, the force F needed to compress or extend that spring is directly proportional to the distance x you stretch it.
In trading, this implies that the further away from the mean that price gets, the more tendency there is for that price to revert to, or go back to, that mean.
Applying Hooke's Law directly to price action is a little of a stretch because it's easy to see how the tensile strength of a spring would force the spring back to its equilibrium, i.e. reverting to its mean length, whereas there's really no 'tensile' strength in a currency market.
There is, however, a sort of tensile strength to price in the market that is represented in that mean, moving average line. That line acts as the long term direction of price, and thus when price gets too far away from it, the tendency of price action is to consolidate back to its mean because satisfaction of order fulfillment has been achieved.
I know, that's a little confusing if you're not experienced in math and physics, so let me put it this way:
So, how do you trade that?
Again, this becomes not an indicator or mathematical solution used as a trigger, but rather a view of changing market conditions that might, could, and possibly should imply that some economic event has occurred that will cause price to revert to it's mean.
And to confirm that this is the case will take time.
Blog Post Video Reference
Of further interest might be the following video covering this topic featured on my YouTube channel for Longwood Currency Trading:
How To Use Moving Averages
Correctly In Your FOREX Trading
Thanks for taking your time to read this post,
Peter
p.s. For more of my thoughts on trading in the FOREX foreign currency market, check out my YouTube channel for Longwood Currency Trading