 Hi, I'm Peter Rose, Founder of Longwood Currency Trading, and welcome to LCT Blog Post 01/14/20 — Regression to the Mean Analysis in FOREX Trading.
One of the phenomena of trading is that of price reversion to the mean where, after a series of large and fast price moves, price will return to its underlying moving average line, i.e. its mean.
An example of Regression to the Mean in FOREX trading — or basically any financial or physical process — would be following price action (or other types of data points) with a moving average, say a 15 period simple moving average (sma).
If price were to decrease quickly, it would take time for the moving average to reflect this, i.e. it would lag behind the declining price. At some point, however, price would slow, and the moving average line would converge back to its 'normal' tracking distance above price.
Let's take a look at this diagrammatically.
As price moves 'normally', the moving average line tracks this movement, but is delayed (and is 'flatter') the greater the period of the moving average.
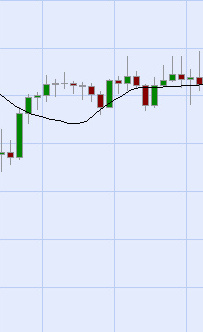
Figure 1: Moving average tracks close to 'normal' price movement.
If price begins to move down faster, then it will take time for the moving average to 'catch up'. In fact, if the price accelerates even more, the gap between it and the associated moving average gets larger.
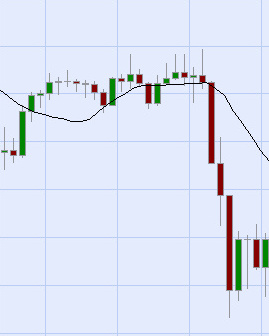
Figure 2: Moving average lags behind rapidly decreasing price.
At some point, two things will occur that represent the regression to the mean, i.e. the mean being represented by that moving average line: price will begin to stop decreasing rapidly, and the moving average line will begin to 'catch up' to price.
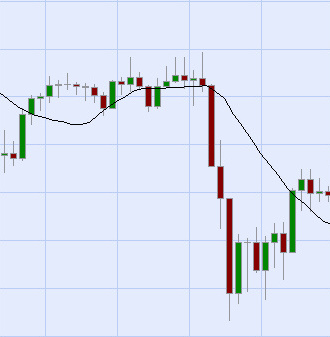
Figure 3: Moving average and price begin to converge as price slows and moving average catches up.
The following Figure 4 shows several of these regression events in a 15 min EUR/USD chart.
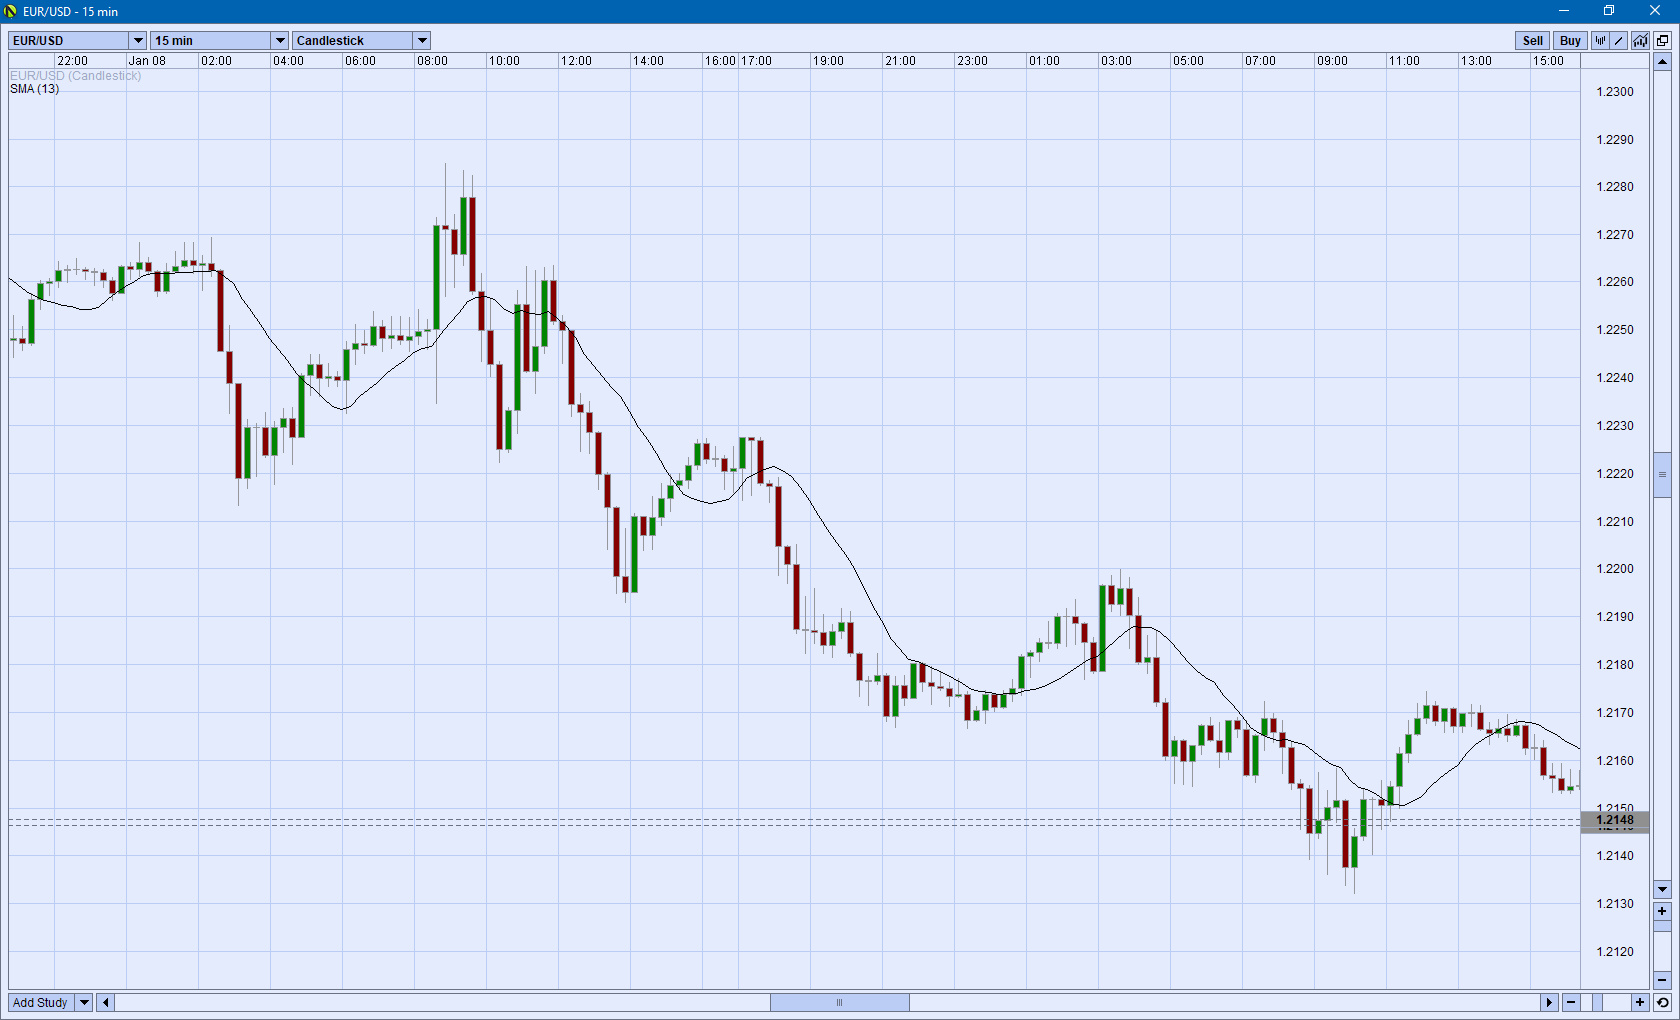
Figure 4: Several of these regression events in a 15 min EUR/USD chart.
So, that's what regression to the mean looks like on a chart. But how would you use that in trading?
The obvious approach would be to wait until price has accelerated way below the moving average line, and begins to slow down. At that point, you could enter a long position, and close when price regresses back to that line.
In the case that price was trending upward, the gap between it and the moving average line would form below the rising price. Your approach would then be to go short when price stalls, and close when it falls back to the moving average line.
That appears to be a fairly straight forward strategy. However, — there's always a 'however', isn't there? — there are some issues to implementing this approach that you need to consider:
There are two possible answers to each of those questions:
That's helpful, isn't it!
In my practice, and in my teaching: I always pick the simplest solution.
However, as a technically oriented person with a B.S. in Physics, almost a minor in math, and a 33 year career as a software engineer: I have the tools (and enjoy) finding the mathematical solutions to these sorts of issues.
If an issue can not be explained, and resolved through mathematics, then, as far as I'm concerned: it's all worthless random crap that I'm not going to concern myself with.
I'm going to discuss the intuitive approach to the solution of those issues in the following video, but cover some of the mathematical implications within the context of this post.
It's important for you to consider both, as intuitive trading is — and must be — based upon the laws of mathematics.
In addition to my video discussion of the more intuitive approach to the implementation of regression to the mean principles, I might suggest that you read Curtis Faith's book Trading From Your Gut. Faith was one of Richard Dennis' original Turtle Traders, and made something like $30 Million Dollars for Dennis during the 4 year period the program ran (or so he says). Regardless, it's a really good read, despite the fact that Faith's life imploded later.
You can watch my video concerning regression to the mean now if you haven't already seen it, or come back to it after I cook your brain with all the technical stuff that follows....
First, some basic back ground on regression to the mean, and why I choose to use this term as opposed to what many might consider a better approach: the concept of 'mean reversion' used in statistical finance.
The term 'Regression to the Mean' was first postulated around 1877 by Sir Francis Galton, an English Victorian era polymath. The principle is defined as
That just describes the diagrams I showed earlier. But it's a 'formal' statement of the term. Now, let's take a look at the other term, mean reversion, used in statistical finance:
That probably would be a more precise method of discussing the topic of reversion.... But, it does limit the scope of the discussion to just financial instruments, whereas 'regression to the mean' is found in all of Nature. Thus, regression to the mean can be described better through the laws of physics than through just statistical analysis.
However.... that is just my opinion. As a 50 plus year practitioner of the martial arts where philosophy plays a huge role beyond that of simple punching and kicking, I find the solutions to life problems by studying the process of the Nature around me, and relating that to the issue.
Though the specific mathematical equation for determining this regression is complex, as shown in the below snapshot from the Wikipedia page, we really don't need to understand anything about that. I post it simply to show that regression to the mean has its foundation in mathematical derivation.
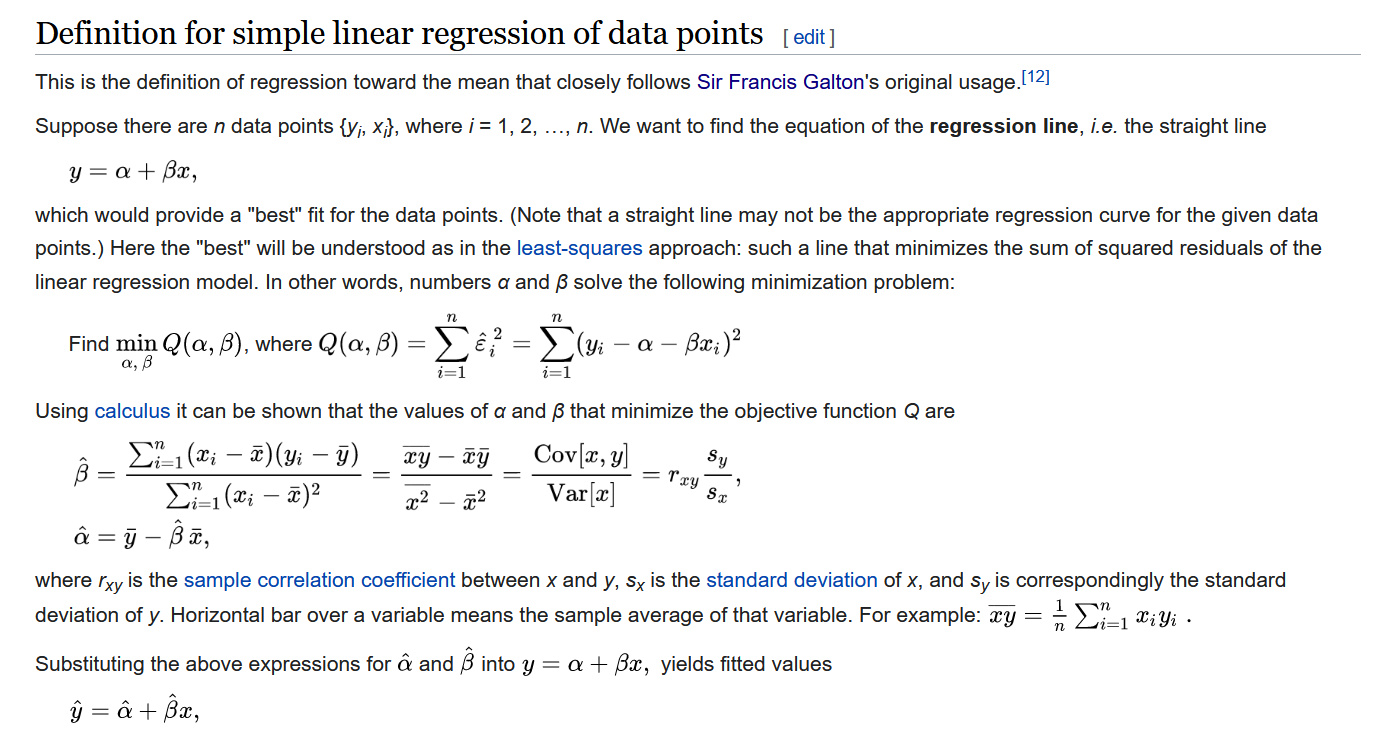
Figure 4: Mathematical equation for the calculation of regression to the mean.
Yeah, that's a mess, right? Yup....
Let's simplify this a little then. When viewing this process of reversion through the lens of regression to the mean, the physics of Hooke's Law provides an excellent metaphor.
And that's a mess mathematically as well, as you'll see by taking a look at the citation link. But, in it's simplest form: Hooke's Law can just be expressed as
Descriptively, this equation demonstrates what happens when you pull a spring apart from its resting state, and then let it go.
Obviously, what happens is that the spring snaps back to its resting state. Traders who are astute to this law can see a similar behavior in the price snapping back to its mean, i.e. its resting state as defined by the current underlying moving average after undergoing an expansion away from that moving average.
However, like most classical mechanics, Hooke's Law only works within a limited frame of reference. Because no material can be compressed beyond a certain minimum size (or stretched beyond a maximum size) without some permanent deformation or change of state, it only applies so long as a limited amount of force or deformation is involved. In fact, many materials will noticeably deviate from Hooke's law well before those elastic limits are reached.
Okay, so now go back to all of those issues I brought up concerning using intuition as opposed to mathematical analysis to determining how to trade a price regression to the mean event. I'll repeat them here:
Based on what you now see as the simple physics of what happens when you stretch a spring, isn't it pretty easy to figure out how to look at this entire process of trading a regression to the mean event based on your trading intuition?
Sure it is. What's intuition based on? It's your experience, right?
So, use your experience watching these sorts of formations occurring to make your decisions in an intuitive manner. Look, it's the same way that a surfer decides which wave to catch, right?
It has nothing to do with the physics or mathematics of it. Rather, it's all about experience and making decisions — intuitive decisions — based on that experience.
So, having said that, just take another — but perhaps different — look at that example 15 minute EUR/USD chart, and let your intuition guide you in evaluating the different scenarios presented on the chart.
Figure 4: Several of these regression events in a 15 min EUR/USD chart.
Thanks for taking your time to read this post,
Peter
p.s. For more of my thoughts on trading in the FOREX foreign currency market, check out my YouTube channel for Longwood Currency Trading