 Hi, I'm Peter Rose, Founder of Longwood Currency Trading, and welcome to LCT Blog Post 07/08/21 — FOREX Market Pricing Verses DOW, SP, DAX.
The status of the pricing of the FOREX market makes comparative analysis against price movements simple.
However, this is not the case in viewing other 'averaged' financial markets like the DOW, S&P, DAX, etc.
The reason for this is the mathematics behind how those markets are priced.
If you’re trading the financial markets, you better understand this difference because otherwise you’re trying to compare an apple with a baseball....
So, this post really is more about pricing issues in markets other than FOREX. The reason for this is because these pricing differences can cause false conclusions to be drawn about the status of those markets by un-knowledgeable people.
We don't trade FOREX in a vacuum. What's going on in all financial markets is a huge factor as to how people not only judge a country's overall economic status, but also how FOREX pair pricing is affected.
FOREX Market PricingSo you get a clear view of the ramifications of these differences, I want to first be sure you understand how FOREX market pricing is established.
Let's use the GBP/USD pair priced at 1.3800 as an example. What exactly does that price represent?
The pair price of 1.3800 means that it's going to cost someone in the U.S. $0.38 USD more to buy something in the U.K. priced at $1.00 GBP (Pound). Conversely, someone in the U.K. changing $1.00 GBP for U.S. currency gets the U.S. product for $0.38 USD less.
The name of the pair 'GBP/USD' is actually the mathematical ratio of the value of 1 GBP to that of the USD, i.e.
And thus,GBP
--- = 1.3800
USD
1
--- = 1.3800
USD
We can flip that around to calculate the value of 1 USD to that of GBP
GBP
--- = 1.3800
USD
1 (GBP) = 1.3800 * USD
USD
--- = 0.7246
GBP
Make sense? The thrust of that example is to show you that the value of the GBP/USD market pair is the true and correct value of that pair with no ambiguity.
Averaging The FOREX MarketThe FOREX market consists of many currency pairs like the USD/GBP such as: AUD/CHF, AUD/SEK, CHF/CZK, DKK/ZAR, JPY/NOK, NZD/DKK, etc.
What would happen if you added up the Friday closing price of all currency pairs (there are 128 that are listed), and divided that by 128 to get the average of the FOREX market? As I'm sure you can imagine, you'd have a meaningless value because of the mix of currencies.
For example what's the average of the following 3 pairs: GBP/USD at 1.3831 US Dollars, AUD/NZD at 1.07101 New Zealand Dollars, and CHF/CZK at 23.4019 Czech Koruny? If you divide by 3, the answer is 8.6186. But what does that mean?
It means... nothing....
What you have to do is pick 1 currency like USD, and find the average of all USD quote pairs. In the case of USD, this is what's called the DXY dollar index.
The Pound GBP, for example, also has an index called BXY (British Pound Currency Index). And that makes sense because each such index is comprised of related currencies expressed in terms of the value of the quote currency.
Averaging The Stock MarketNow, let's take a look at valuing information from the Dow Jones Industrial Average, as an example so we can then compare that to valuing the FOREX market.
The Dow Jones Industrial Average is one of the most prominent financial metrics in the world.
Though it is referred to as the DOW 30, meaning that there are 30 stocks in that average, this is not the case. Because of changes to the average, there are currently only 29 stocks in the DOW 30. There is an article on Investopedia (Dow 30 Is Now Dow 29 as Dow Inc. Does Not Belong' by Richard Suttmeier - Updated Jun 25, 2019) that describes when and why this happened. But regardless of that, the DOW 30 represents the most reflective and accepted status of the American economy.
And therein lies the problem: It's an average.
Yeah, so?
Well, as it turns out it's not an average. Well, more correctly: it's not a correctly computed average.
What is an average? It's a number of prices added together and then divided by the number of prices.
Let's make it easy and just look at calculating the average of 3 stocks, each priced at $30. The total is $90, and because there are just 3 stocks, then $90/3 is $30. How quaint....
Let's call my little average here the Organization Against Kryptonite 3, or OAK for short. Catchy, hu?
So, right now OAK looks like this: A = $30, B = $30, C = $30 totaling $90 with an average of $30 per share.
What is the average if C increases $1 to $31?
OAK:: A = $30, B = $30, C = $31 totaling $91 with an average of $30.33 per share.
So, by C increasing $1, the average increased by $0.33. Fair enough, but what's the point here?
Okay, what happens if all 3 companies in OAK stabilize back to $30 per share; an average of $30, but company C decides, as many companies do from time to time, that it's share price of $30 is too expensive - that folks would be more inclined to trade C if its price was to be $15.
In order to do that, C has to double the number of outstanding shares, i.e. 1, to 2 shares, each priced at $15 to equate to the current $30 stock price.
So, now OAK looks like this: A = $30, B = $30, C = $15 totaling $75 with an average of $25 per share.
Whoa! What happened to that? You can't now open the OAK market from a close yesterday at an average of $30 with an average of $25! People would scream about not have a consistently stated average that could be analyzed correctly.
Well, you did analyze it correctly: it's got an average value of $25 per share because the total value of the 3 stocks of $75 divided by those 3 stocks is... well, it's $25.
Here's the problem: what can you do with those 3 stocks such that the average will still total $30 even after the split?
This is valid to require because the split did nothing to change the capitalization of company C. Pre-split, the company had 1 share priced at a total value of $30, and after the split to $15 a share with 2 shares the company still has a capitalization or total value of $30 (2 shares at $15 = $30). None of that information can be changed.
So what could we change to make the OAK average $30 after C splits their shares? The solution equation looks like this:
First, here's the equation for averaging:
average = (A + B + C) / 3
And here is the data:
30 = (30 + 30 + 15) / 3
But that does not equal 30. How about if we restate the equation with 3 being a new variable called 'divisor'....
30 = (30 + 30 + 15) / divisor
30 = 75 / divisor
divisor = 75 / 30
divisor = 2.5
Whoa! There are 3 companies in OAK, so the divisor has to be 3, and not 2.5 to be a correct average. Yup.... But to make the average consistent with the previous close, the 'divisor' has to drop from 3 to 2.5.
And that's a problem.
Why?
Because, now, if the price of company C goes up $1 to $16 per share then the new 'average' becomes $76 / 2.5 which is: $30.40.
So?
So look: In OAK both examples pre-split and split have the same $1 increase. In the pre-split example, this raised the average to $30.33, but after the split the average became $30.40, or $0.07 more.
And why is this a problem?
Because nothing different happened and yet the average after split increased the value of OAK by $0.07!!!
Now, run this same logic out with 30 stocks (or 500, or 2000) with some of the higher priced stocks changing maybe $20 in a day. What do you think the result on the average value of that market will do? It's going to inflate the average tremendously!
When the DOW was established, the divisor was 30. With all of the stocks splitting over the years and prices going way up: what do you think the divisor must be now?
Let that sink in just a little: back in 2018 with the divisor at 0.14748071991788, any stock that rose $1 caused the underlying 'average' to increase by $6.78!!!!
I did some research on the DOW the other day. Adding up the values of all last closing prices came to $5,023.40 and the average of those 29 stocks is $173.22. However, the posted average is $34,501.94.
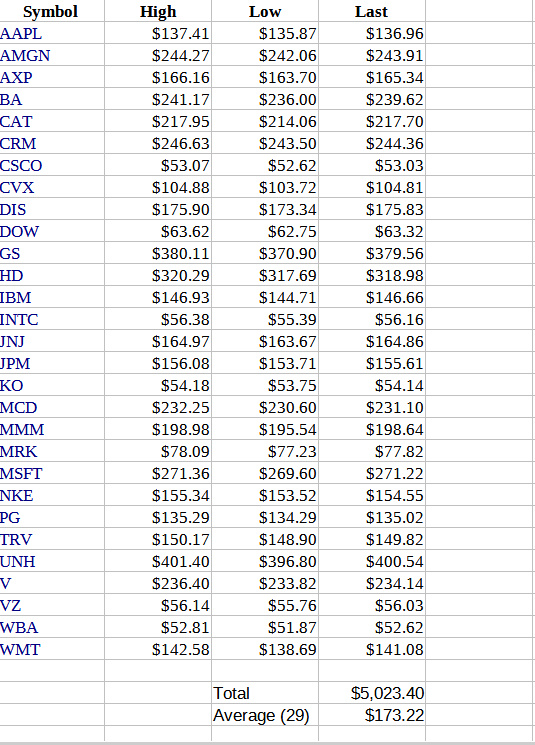
DOW 07/01/21
Terrific.... As you can see from the data I gathered for 07/01/21, the real average is $173.22 and the posted average is $34,501.94.
That makes a lot of sense, doesn't it.... If just 1 stock went up $10, it would cause the 'average' to go up about $68, and that's using the divisor from 2018!!! And that keeps skewing the average (of not only the DOW here, but any index that is an 'average', i.e. S&P, DAX, etc.
Summing It All UpSo, how do you really manage your view of what's really going on in such a market?
Beats me..... However....
Companion Video
Here's that companion video of the same title: FOREX Market Pricing Verses DOW, SP, DAX I mentioned at the start of this post that puts all of this together from a different view point.
Thanks for taking your time to read this post,
Peter
p.s. For more of my thoughts on trading in the FOREX foreign currency market, check out my YouTube channel for Longwood Currency Trading